Image Details
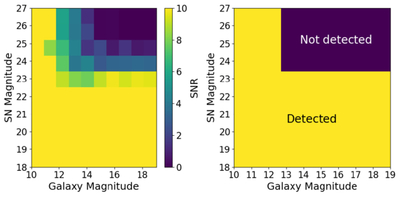
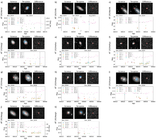
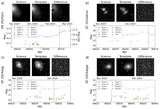
Caption: Figure 2.
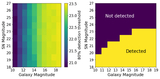
The left panel shows the SNR of the difference image after injecting a galaxy and a star in the science image, and only a galaxy in the template image of Rubin DP0. This was done repeatedly for different magnitudes of the star and galaxy. The right panel shows which areas of this parameter space would be counted as detections using the default SNR > 5 threshold. This shows that very faint targets that could not have been detected are incorrectly classified as detections when their host galaxies are very bright (mgal ≲ 13 mag).
Other Images in This Article
Show More
Copyright and Terms & Conditions
© 2026. The Author(s). Published by the American Astronomical Society.
Copyright ©
2026 Astronomy Image Explorer. All Rights Reserved.