Image Details
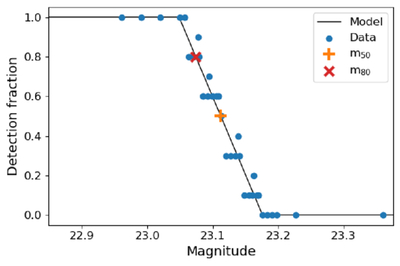
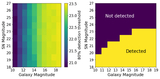
Caption: Figure 6.
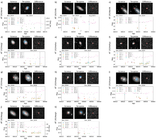
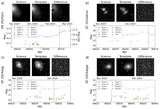
The empirical recovery curve (blue dots) as well as the fitted model (black line) are shown in this figure. We also calculate the 50% and 80% detection thresholds (m50 and m80), indicated with the orange upright cross (“+”) and red diagonal cross (“×”).
Other Images in This Article
Show More
Copyright and Terms & Conditions
© 2026. The Author(s). Published by the American Astronomical Society.
Copyright ©
2026 Astronomy Image Explorer. All Rights Reserved.