Image Details
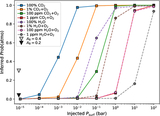
Caption: Figure 12.
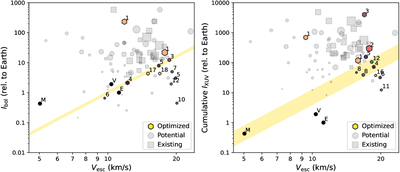
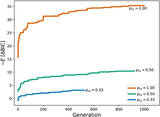
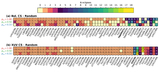
The optimal set of targets for maximizing the ΔBIC between each Cosmic Shoreline and the pessimist hypotheses, using pcs = 1.00 for the injected bolometric (left panel) and XUV Cosmic Shorelines (right panel; see also the top rows of Figure 14). The colors correspond to the number of eclipses as indicated in the color bar in Figure 14. Targets not included are plotted in gray.
Other Images in This Article
Show More
Copyright and Terms & Conditions
© 2026. The Author(s). Published by the American Astronomical Society.
Copyright ©
2026 Astronomy Image Explorer. All Rights Reserved.