Image Details
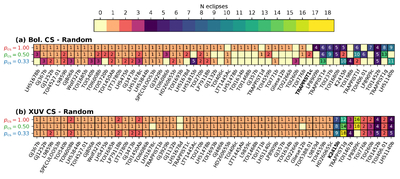
Caption: Figure 9.
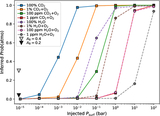
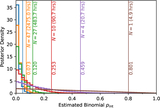
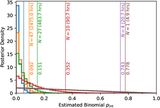
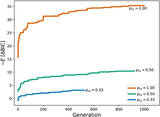
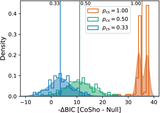
The optimal set of observations for the distinguishing Cosmic Shoreline vs. random hypothesis for three different values of pcs = 1, 1/2, and 1/3 for the bolometric (top panel) and the XUV Cosmic Shoreline hypotheses. Planets have atmospheres at random with no particular trend in the random hypothesis. The optimal set maximizes ﹩-{\mathbb{E}}[{\rm{\Delta }}{\rm{BIC}}]﹩ across 100 different Monte Carlo draws. Targets that are not included at least once for the three values of pcs are not shown. In the top panel, there are 47, 38, and 32 total targets in each row; in the bottom panel, there are 52, 50, and 52. Targets are ordered by the respective priority metric, such that targets farther to the right are farther on the wet side of the Cosmic Shoreline. The injected Cosmic Shoreline passes through TRAPPIST-1 c for the bolometric and K2-415 b for the XUV (marked in bold).
Other Images in This Article
Show More
Copyright and Terms & Conditions
© 2026. The Author(s). Published by the American Astronomical Society.