Image Details
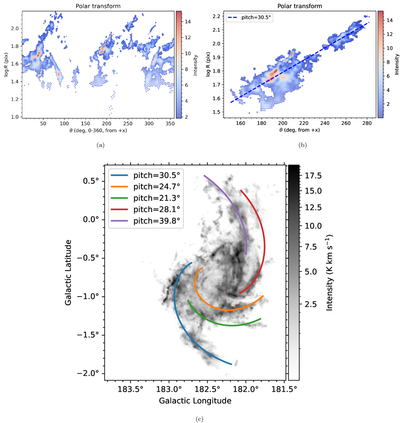
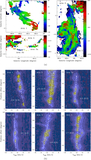
Caption: Figure 3.
Pitch-angle fitting toward the spiral arms. (a) Polar-coordinate representation of the residual intensity map obtained by subtracting the Gaussian-smoothed image from the integrated intensity map (see details in the text for Gaussian convolution). The horizontal axis denotes the azimuthal angle in the polar frame (0° along the positive x-axis, increasing counterclockwise), and the vertical axis shows the logarithmic radial distance from the center in units of pixels. The color of each point is weighted by the residual intensity. (b) Zoom-in view of one spiral arm (Arm 1) in panel (a), together with the logarithmic-spiral fitting result. The fitting is performed with intensity weighting. (c) Fitted spiral arms overlaid on the integrated intensity map. The pitch angles of the arms are labeled in the upper-left corner.
Other Images in This Article
Show More
Copyright and Terms & Conditions
© 2026. The Author(s). Published by the American Astronomical Society.