Image Details
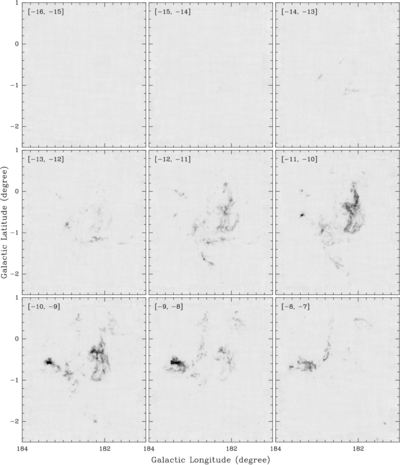
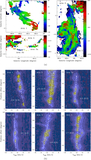
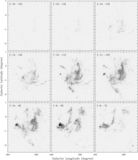
Caption: Figure 10.
Velocity-integrated intensity channel maps of the MWISP 13CO emission. The integrated velocity range is written in the top-left corner of each panel (in km s−1). For all the panels, the scale bar is from −1 to 4 K km s−1, where 1σ is ∼ 0.1 K km s−1.
Other Images in This Article
Show More
Copyright and Terms & Conditions
© 2026. The Author(s). Published by the American Astronomical Society.
Copyright ©
2026 Astronomy Image Explorer. All Rights Reserved.