Image Details
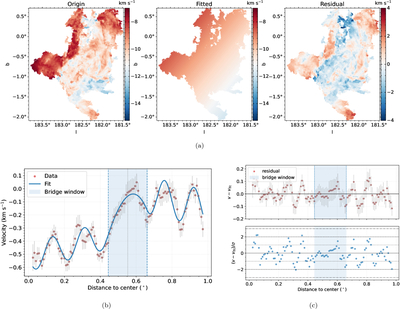
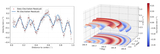
Caption: Figure 7.
Panel (a) presents the intensity-weighted centroid velocity map, the two-dimensional first-order fit to the observed velocity field, and the corresponding residual map. Panel (b) shows the radial profile extracted from the residual map, while panel (c) displays the variations of the absolute (upper) and relative (lower) residuals obtained from the piecewise fitting. The blue curve in the panels (b) and (c) represents the best-fitting piecewise sinusoidal function, with amplitudes of 0.11 and 0.13 km s−1 and corresponding periods of 0﹩\mathop{.}\limits^{^\circ }﹩18 and 0﹩\mathop{.}\limits^{^\circ }﹩16 for the left and right segments, respectively. The blue-shaded regions indicate the bridging intervals connected by the cubic Hermite spline.
Other Images in This Article
Show More
Copyright and Terms & Conditions
© 2026. The Author(s). Published by the American Astronomical Society.