Image Details
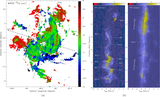
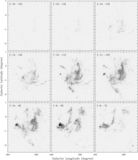
Caption: Figure 5.
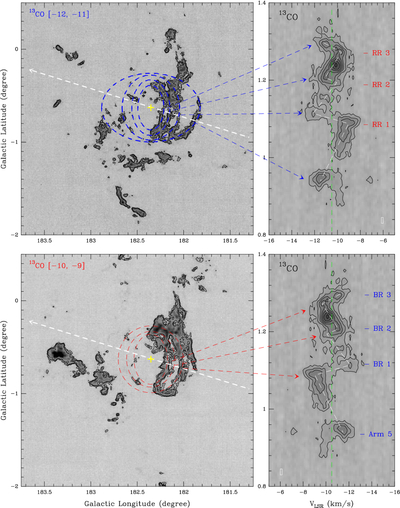
MWISP 13CO intensity images and PV diagrams. The top-left panel shows the intensity image integrated within [−12, −11] km s−1. Contours correspond to 5, 7, and 10 σ (1σ ∼ 0.1 K km s−1). Four blue dashed-line ellipses show the fitted results toward the Arm 5 and three inner rings. The dashed white arrow line shows the routing of the PV diagram shown in the top-right panel. In the PV diagram, contours start from 0.3 K and increase in steps of 0.3 K (1σ ∼ 0.075 K). The dashed green line shows the systemic velocity, while the dashed white line shows the oscillation of the radial velocity. The positions of the RRs are labeled. The bottom-left panel shows an intensity image integrated within [−10, −9] km s−1. Contours correspond to 6, 9, and 12σ. Three red dashed-line ellipses show the fitted results toward the three inner rings. The bottom-right panel is the same as the top-right panel, while the positions of Arm 5 and BRs are labeled.
Other Images in This Article
Show More
Copyright and Terms & Conditions
© 2026. The Author(s). Published by the American Astronomical Society.