Image Details
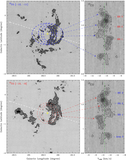
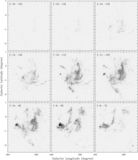
Caption: Figure 4.
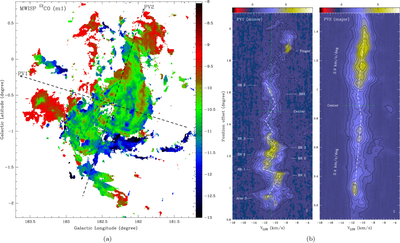
(a) Velocity field (moment 1 image) of the MWISP 12CO emission. The image is integrated within the velocity range of [−13, −8] km s−1. The dashed arrow lines show the routings of the PV diagrams shown in panel (b). (b)12CO PV diagrams along the minor and major axes of the spiral cloud. For the PV1 (minor axis), contours correspond to 0.6, 1.0, 1.6 K, and then increase in steps of 0.6 K (1 σ ∼ 0.14 K). The positions for the BRs and RRs are marked. The white dashed lines show the oscillation of the radial velocities (for guiding eyes) along the minor axis. The green dashed lines show the systemic velocity and geometric center of the cloud. For the PV2 (major axis), the contours start from 0.6 K and then increase by steps of 0.6 K. The white dashed lines show the S-shaped velocity gradients along the major axis.
Other Images in This Article
Show More
Copyright and Terms & Conditions
© 2026. The Author(s). Published by the American Astronomical Society.