Image Details
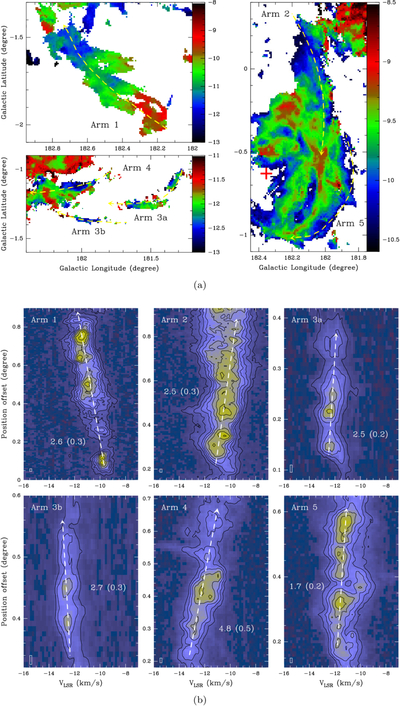
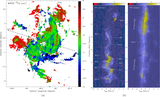
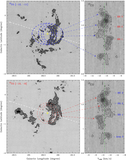
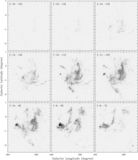
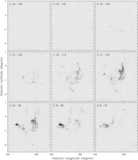
Caption: Figure 6.
Velocity fields and PV diagrams of the spiral arms. (a)The three panels show the velocity fields of the five identified spiral arms. The dashed yellow arrow lines show the routings of PV diagrams for the individual spiral arms. (b)The six panels show the PV diagrams for the arms. In each panel, the dashed white arrow line shows the linear fitting toward the velocity gradient seen along the individual spiral arm. The fitted results and uncertainties (in units of km s−1 deg−1) are shown in each panel. For Arms 1–3, the contours start from 0.8 K and increase in steps of 0.8 K. For Arms 4–5, the contours start from 1.6 K and increase in steps of 0.8 K.
Other Images in This Article
Show More
Copyright and Terms & Conditions
© 2026. The Author(s). Published by the American Astronomical Society.