Image Details
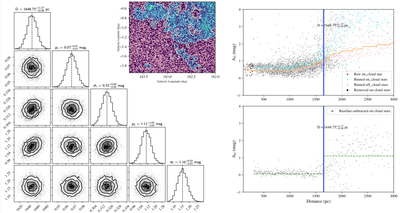
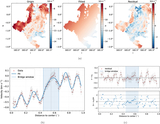
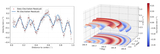
Caption: Figure 12.
Distance measurement toward the spiral molecular cloud. The central panel shows the MWISP 12CO intensity image of the spiral molecular cloud, and the gray contour shows the edge of the cloud (3σ threshold). Cyan and pink dots represent on- and off-cloud Gaia DR3 stars. In the top-right panel, cyan and pink points represent on- and off-cloud stars (binned every 5 pc), respectively. The blue vertical line indicates the distance (D) estimated with Bayesian analyses and MCMC sampling, and the shadow area depicts the 95% highest posterior density (HPD) distance range. The corner plots of the MCMC samples are displayed in the bottom-left panel (distance, the extinction of foreground and background stars, and uncertainties). The mean and 95% HPD of the samples are shown with solid and dashed vertical lines, respectively.
Other Images in This Article
Show More
Copyright and Terms & Conditions
© 2026. The Author(s). Published by the American Astronomical Society.