Image Details
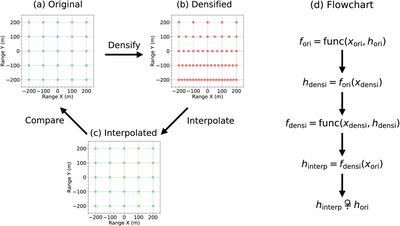
Caption: Figure A8.
Diagrams illustrating the procedure used to evaluate the fidelity of interpolated surface elevations. In panel (a), the original (blue) elevation data have a uniform resolution. In panel (b), the resolution of the densified (red) elevation data decreases from top to bottom, which mimics the resolution of elevation data in a simple cylindrical projection. In panel (c), the interpolated (green) elevation data were obtained by interpolating the densified elevation data to the resolution of the original elevation data. In panel (d), a flowchart summarizes the procedure, where xori and xdensi denote the x-coordinates of the original and densified elevations, hori, hdensi, and hinterp represent the original, densified, and interpolated elevations, and fori and fdensi indicate the relations (denoted by “func”) between the x-coordinate and elevation for the original and densified datasets.
Other Images in This Article
Show More
Copyright and Terms & Conditions
© 2026. The Author(s). Published by the American Astronomical Society.