Image Details
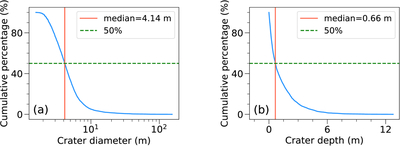
Caption: Figure A3.
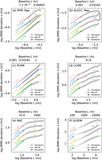
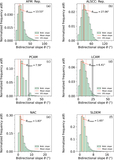
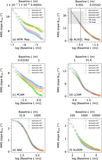
Cumulative frequency distributions (blue solid lines) of the diameters (panel (a)) and depths (panel (b)) of the identified craters in the LCAM ROI. The 50% level is indicated by the green dashed line, and the median value is shown by the red solid line.
Other Images in This Article
Show More
Copyright and Terms & Conditions
© 2026. The Author(s). Published by the American Astronomical Society.
Copyright ©
2026 Astronomy Image Explorer. All Rights Reserved.