Image Details
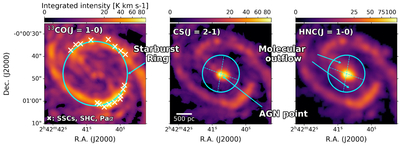
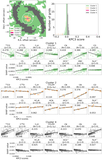
Caption: Figure 1.
The integrated intensity maps of NGC 1068. The left panel presents the 13CO(J = 1–0) integrated intensity map. The crosses indicate the positions of the SSC, SHC, and Paα regions defined in F. Rico-Villas et al. (2021). Note that the circle marking the starburst ring is not a strict definition, but only shows its approximate location. The middle and right panels show the CS(J = 2–1) and HNC(J = 1–0) integrated intensity maps, respectively. The central circle indicates the field of view (FoV) of the [C I] data. The region outlined with dotted arrows marks the direction of the molecular outflow (T. Saito et al. 2022a, 2022b). The diameter of the circle is 1 kpc.
Other Images in This Article
Copyright and Terms & Conditions
© 2026. The Author(s). Published by the American Astronomical Society.