Image Details
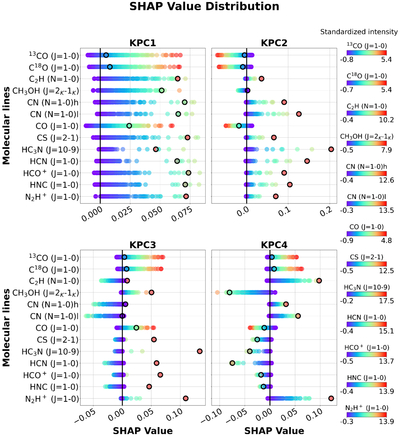
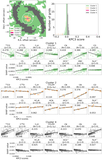
Caption: Figure 4.
Kernel SHAP results. The top row shows the SHAP values for the KPC1 scores on the left and for the KPC2 scores on the right, while the second row shows those for the KPC3 scores on the left and for the KPC4 scores on the right. The color represents the standardized integrated intensity of each molecular line used in the analysis. In each figure, the x-axis corresponds to the SHAP value and the y-axis corresponds to the molecular lines. The black-outlined points indicate the grid at the AGN position.
Other Images in This Article
Copyright and Terms & Conditions
© 2026. The Author(s). Published by the American Astronomical Society.
Copyright ©
2026 Astronomy Image Explorer. All Rights Reserved.