Image Details
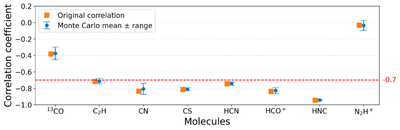
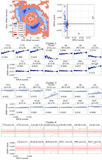
Caption: Figure 7.
Correlation between the molecular column densities and the negative scores for Cluster 2 in the upper-left panel of Figure 5. The orange squares represent the correlation obtained using the original column densities. The blue circles represent the mean correlation derived from Monte Carlo simulations, and the error bars indicate the ±1σ uncertainty estimated from the Monte Carlo results.
Other Images in This Article
Copyright and Terms & Conditions
© 2026. The Author(s). Published by the American Astronomical Society.
Copyright ©
2026 Astronomy Image Explorer. All Rights Reserved.