Image Details
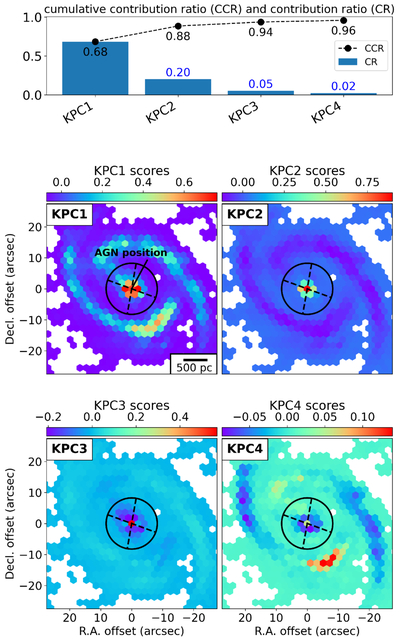
Caption: Figure 3.
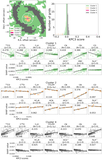
Kernel PCA results. The first row shows the contribution ratio (CR) and cumulative contribution ratio (CCR). The second row displays the KPC1 map on the left and the KPC2 map on the right, while the third row shows the KPC3 map on the left and the KPC4 map on the right. The color represents the KPCi scores. The black circle marks the field of view (FoV) of the [C I] data (T. Saito et al. 2022a). The crossed dashed lines denote the direction of the outflow (T. Saito et al. 2022b).
Other Images in This Article
Copyright and Terms & Conditions
© 2026. The Author(s). Published by the American Astronomical Society.
Copyright ©
2026 Astronomy Image Explorer. All Rights Reserved.