Image Details
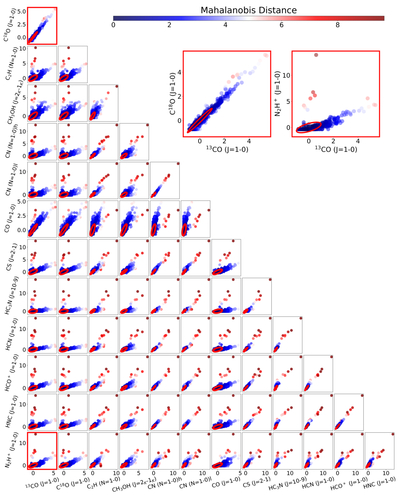
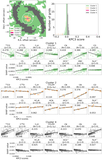
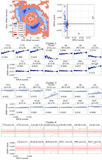
Caption: Figure 2.
Correlation plot between two standardized molecular lines. The color indicates the Mahalanobis distance, which accounts for the correlation between the two variables. The red ellipse represents a Mahalanobis distance of 1. These plots correspond to the maps shown in Figure 1 (left), Figure 2, and Figure 3 of H. Okubo et al. (2025). In addition, the two panels shown in the upper right are enlarged views of the 13CO(J = 1–0)–C18O(J = 1–0) and 13CO(J = 1–0)–N2H+(J = 1–0) plots.
Other Images in This Article
Copyright and Terms & Conditions
© 2026. The Author(s). Published by the American Astronomical Society.
Copyright ©
2026 Astronomy Image Explorer. All Rights Reserved.