Image Details
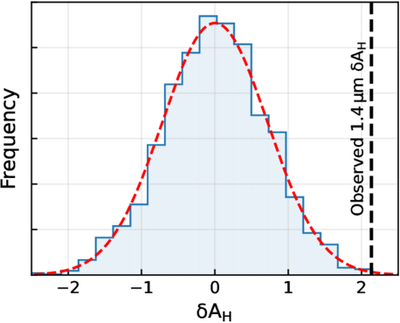
Caption: Figure 8.
Distribution of δAH values from 10,000 injection-recovery tests with no underlying limb asymmetry. The red dashed curve shows the best-fitting Gaussian distribution (μ = −0.012, σ = 0.717). The observed δAH (black dashed line) for the 1.4 μm H2O band of 2.13 is in the 99.72th percentile of the distribution, making it a ∼2.6σ outlier. Read another way, potential morning–evening asymmetry around 1.4 μm is ∼2.6σ significant based on this test.
Other Images in This Article

Copyright and Terms & Conditions
© 2026. The Author(s). Published by the American Astronomical Society.
Copyright ©
2026 Astronomy Image Explorer. All Rights Reserved.