Image Details
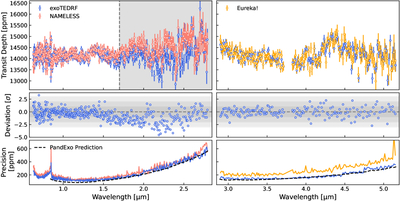
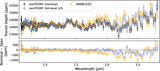
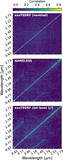
Caption: Figure 2.
Comparison between our nominal exoTEDRF spectra and alternate reductions with NAMELESS for NIRISS (left panels) and Eureka! for NIRSpec (right panels). Top: the two spectra produced for each instrument overplotted. The gray shading in the NIRISS panel denotes wavelengths not used in the comparative retrievals (see Section 3). Middle: error-normalized differences for each instrument. There is a significant divergence between the two NIRISS/SOSS spectra redwards of ∼1.7 μm, which can be attributed to differences in 1/f noise correction methodologies (see Appendix B). Bottom: light curve scatter as a function of wavelength compared to PandExo predictions.
Other Images in This Article

Copyright and Terms & Conditions
© 2026. The Author(s). Published by the American Astronomical Society.