Image Details
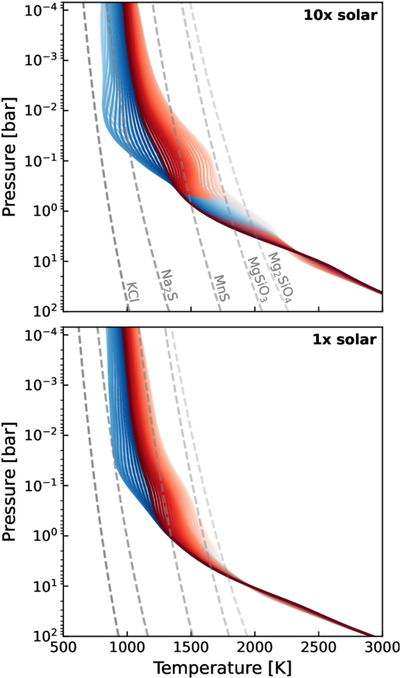
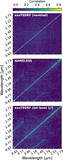
Caption: Figure 7.
PT profiles derived from cloud-free UM GCM simulations of WASP-96 b at solar (bottom) and 10× solar (top) metallicity, which bracket our derived atmosphere composition. Blue and red profiles represent the morning and evening hemispheres, respectively. Levels of fading denote latitude, with the boldest colors being polar latitudes. Condensation curves for prominent condensate species (labeled) are shown with gray dashed lines.
Other Images in This Article

Copyright and Terms & Conditions
© 2026. The Author(s). Published by the American Astronomical Society.
Copyright ©
2026 Astronomy Image Explorer. All Rights Reserved.