Image Details
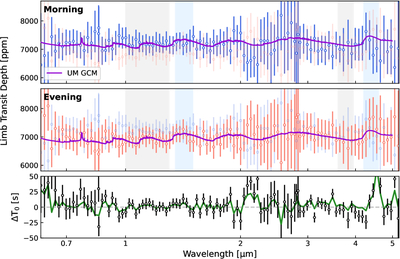
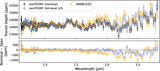
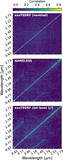
Caption: Figure 3.
WASP-96 b’s morning and evening limb transmission spectra as observed with JWST. Top: the morning-limb transmission spectrum (blue data points) compared to the evening limb spectrum (faded red). Overplotted in purple is the morning-limb spectrum from the aerosol-free, 10× solar UM GCM run (see Appendix C). Blue and gray shaded rectangles denote the in-band and out-of-band wavelengths, respectively, for the H2O and CO2 band amplitude calculations (see Section 5.1). Middle: inverse of the above, focusing on the evening limb spectrum. Bottom: fitting midtransit time as a function of wavelength assuming a uniform-limb (i.e., batman) planet (black points). In green is the T0 spectrum derived from the asymmetric catwoman fits using the formalism of M. M. Murphy et al. (2024a).
Other Images in This Article


Copyright and Terms & Conditions
© 2026. The Author(s). Published by the American Astronomical Society.