Image Details
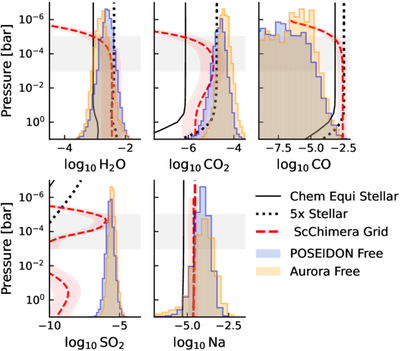
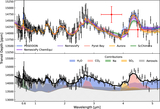
Caption: Figure 5.
Abundances of several prominent chemical species inferred from the POSEIDON (blue histograms) and Aurora (orange histograms) free retrievals. Overplotted are chemical equilibrium abundance profiles for a stellar (logZ∼2× solar, C/O=0.42; solid) and 5× stellar (logZ∼10× solar; dotted) metallicity atmosphere, as well as constraints from the self-consistent grid (red). The gray shaded regions denote the approximate pressures probed by these observations. Solar abundances are taken to be those from M. Asplund et al. (2009) to match N. K. Nikolov et al. (2022).
Other Images in This Article

Copyright and Terms & Conditions
© 2026. The Author(s). Published by the American Astronomical Society.
Copyright ©
2026 Astronomy Image Explorer. All Rights Reserved.