Image Details
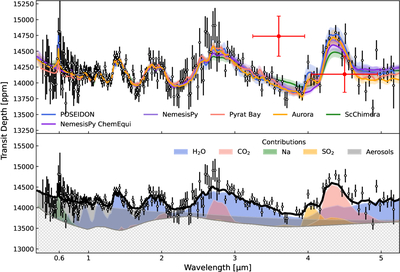
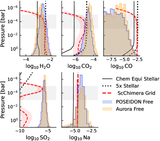
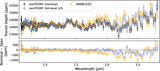
Caption: Figure 4.
Results of modeling WASP-96 b’s transmission spectrum. Top: best-fitting atmosphere models from each retrieval code (colored lines) along with the 2σ confidence envelopes (colored shading) overplotted on the combined ground-based + JWST spectrum (black data points). The JWST data have been binned from the nominal resolution of R = 300 to R ∼ 100 for plotting purposes. Also shown in red, but not included in the retrievals, are the Spitzer 3.6 and 4.5 μm transit depths from N. K. Nikolov et al. (2022). The 3.6 μm point in particular, is discrepant with the NIRSpec observations. Bottom: spectral decomposition of the transmission spectrum to show contributions from various chemical species as well as aerosols (here primarily a scattering slope).
Other Images in This Article

Copyright and Terms & Conditions
© 2026. The Author(s). Published by the American Astronomical Society.