Image Details
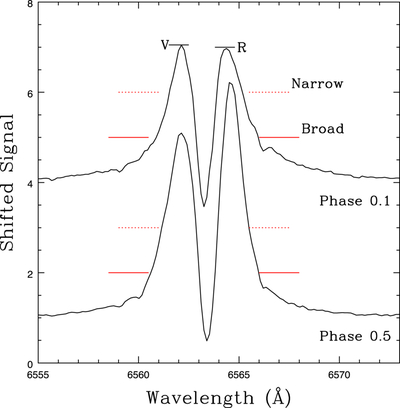
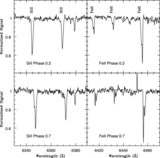
Caption: Figure 8.
Hα profiles extracted from the mean of spectra in the phase intervals 0.05–0.15 (top spectrum) and 0.45–0.55 (bottom spectrum). The locations of the V and R measurements are indicated for the phase 0.1 profile. The points in the line profile where the velocity measurements were made are marked with the solid (broad component) and dashed (narrow component) red lines. The height and shape of Hα both change with phase. The red edge of the phase 0.1 emission profile bulges out near its base, indicating that there is an emission source that is receding from the system. This feature is less pronounced in the phase 0.5 profile.
Other Images in This Article
Show More
Copyright and Terms & Conditions
© 2026. The Author(s). Published by the American Astronomical Society.