Image Details
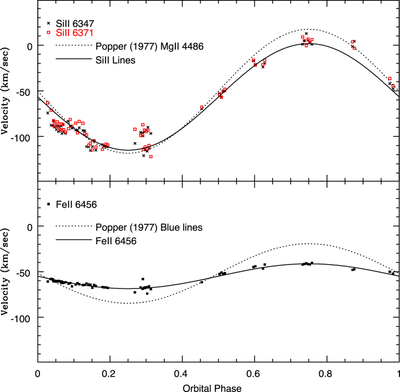
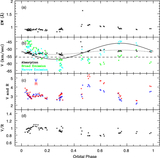
Caption: Figure 6.
Phased velocity curves obtained from the cores of Si II 6347, Si II 6371, and Fe II 6456. The scatter in the Fe II measurements at a given phase suggests a measurement uncertainty of ±1–2 km s−1, while the scatter among the Si II measurements suggests a ± 5 km s−1 uncertainty. A cycle-to-cycle dispersion in the Si II and Fe II measurements is seen near phase 0.3. The solid lines are fits to the measurements that assume a circular orbit. Velocities from the Si II lines were averaged together to generate the Si II curve. Velocity curves based on measurements made by D. M. Popper (1977) at shorter wavelengths are shown as dotted lines for Mg II 4481 (top panel) and for other lines at blue wavelengths (bottom panel).
(The data used to create this figure are available in the online article.)
(The data used to create this figure are available.)
Other Images in This Article
Show More
Copyright and Terms & Conditions
© 2026. The Author(s). Published by the American Astronomical Society.