Image Details
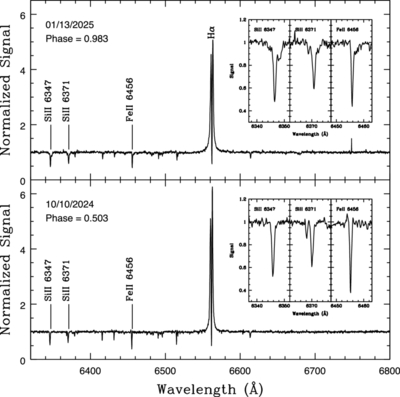
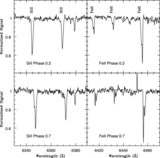
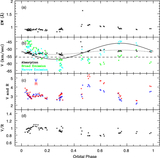
Caption: Figure 1.
Spectra near phases 0.0 (top panel) and 0.5 (bottom panel). The insets show 15Å wide intervals that are centered on the Si II 6147, Si II 6171, and Fe II 6456 lines, which are the basis for the velocity measurements discussed in Section 5. The line profiles clearly differ with orbital phase.
Other Images in This Article
Show More
Copyright and Terms & Conditions
© 2026. The Author(s). Published by the American Astronomical Society.
Copyright ©
2026 Astronomy Image Explorer. All Rights Reserved.