Image Details
Caption: Figure 9.
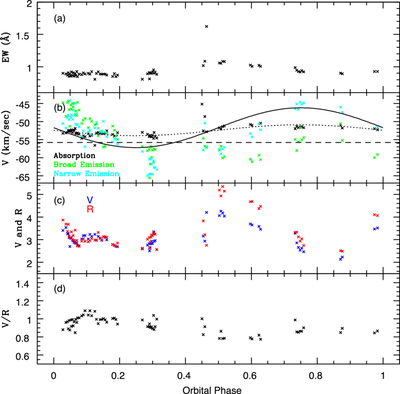
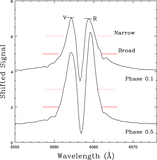
Phase-related characteristics of Hα absorption and emission. Panel (a): the equivalent width of the absorption component. Panel (b): heliocentric velocities of the absorption and emission components. The dashed line is the mean of the γ velocities measured from Si II and Fe II in Table 2, while the dotted line is a fit to the Hα absorption velocities assuming a circular orbit that is in phase with that of the primary. The velocity of Hα absorption varies with orbital phase in approximate sync with the motion of the primary. The solid line is a fit to the narrow emission velocities assuming motion that is synced with the primary. There is substantial scatter about the fit, with a possible phase lag with respect to the motion of the primary. The motion of the broad emission component is clearly out of sync with that of the primary and this is likely due to a kinematically distinct Hα component that appears at some phases (see the text). Panel (c): the heights of the pseudo-peaks that bracket the absorption line, which vary with orbital phase and are strongest between phases 0.45 and 0.65. Panel (d): V/R, which also varies with orbital phase. The variation in V/R is likely due in part to the relative motions of the absorption and emission components.
(The data used to create this figure are available in the online article.)
(The data used to create this figure are available.)
Other Images in This Article
Show More
Copyright and Terms & Conditions
© 2026. The Author(s). Published by the American Astronomical Society.