Image Details
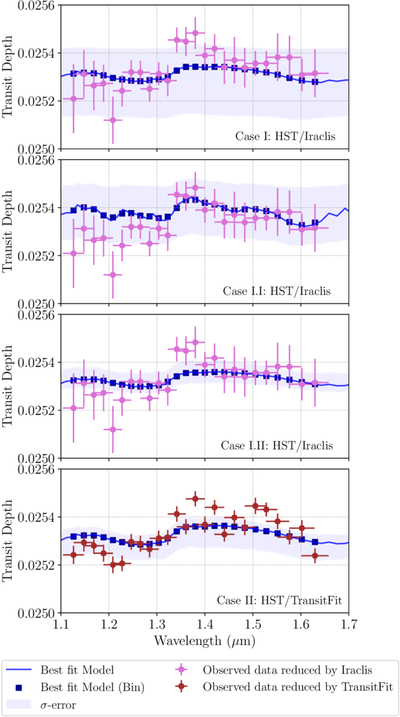
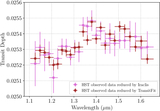
Caption: Figure 9.
The best-fit transmission spectrum model of WASP-43 b derived from HST data. The synthetic model generated by TauREx is shown as a solid blue line, with the corresponding 1σ confidence region indicated by the blue shading. The binned best-fit model values are shown as blue squares. The transit depths computed with Iraclis and TransitFit are shown as pink and dark-red circles, respectively.
Other Images in This Article
Show More
Copyright and Terms & Conditions
© 2026. The Author(s). Published by the American Astronomical Society.
Copyright ©
2026 Astronomy Image Explorer. All Rights Reserved.