Image Details
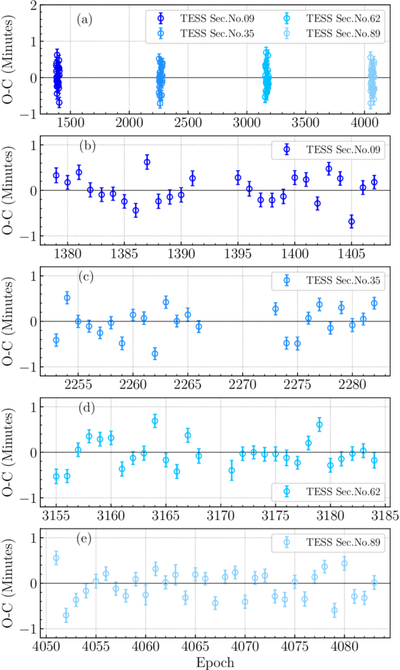
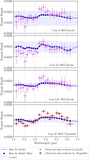
Caption: Figure 5.
The O − C diagram for the TESS datasets. (a) The O − C data from observations in TESS three sectors over a 5 yr interval. (b−e) The O − C data plotted by individual sectors for clearer visibility.
Other Images in This Article
Show More
Copyright and Terms & Conditions
© 2026. The Author(s). Published by the American Astronomical Society.
Copyright ©
2026 Astronomy Image Explorer. All Rights Reserved.