Image Details
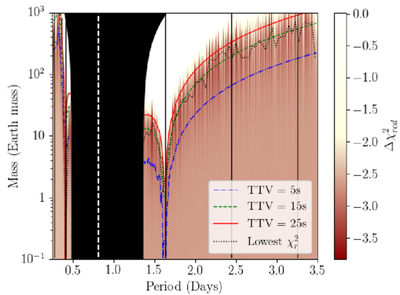
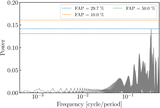
Caption: Figure 7.
Upper mass limit of the perturbing planet in the WASP-43 system. The best ﹩{\rm{\Delta }}{\chi }_{{\rm{red}}}^{2}﹩ values, binned with a period ratio of 0.05, are shown as the black dotted line. The upper mass limits for TTV amplitudes of 5, 15, and 25 s are represented by the blue dashed–dotted, green dashed, and red solid lines, respectively. The white vertical line represents the orbital period of WASP-43 b. The black vertical lines, from left to right, indicate the orbital period resonances of 2:1, 1:2, 1:3, and 1:4. The contour illustrates the ﹩{\rm{\Delta }}{\chi }_{{\rm{red}}}^{2}﹩ values from comparing the best TTV model to the best linear model. The unstable orbit region is shown as the shaded black area.
Other Images in This Article
Show More
Copyright and Terms & Conditions
© 2026. The Author(s). Published by the American Astronomical Society.