Image Details
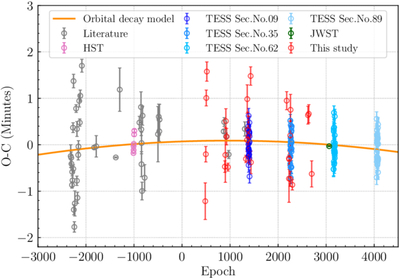
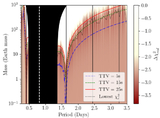
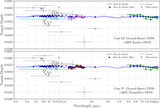
Caption: Figure 3.
The O − C diagram and best-fitting timing models for WASP-43 b, including data from the literature (gray circles), HST (pink circles), TESS (blue circles), JWST (green circles), and this study (red circles), are shown. The orange line represents the timing residuals of the orbital decay model.
Other Images in This Article
Show More
Copyright and Terms & Conditions
© 2026. The Author(s). Published by the American Astronomical Society.
Copyright ©
2026 Astronomy Image Explorer. All Rights Reserved.