Image Details
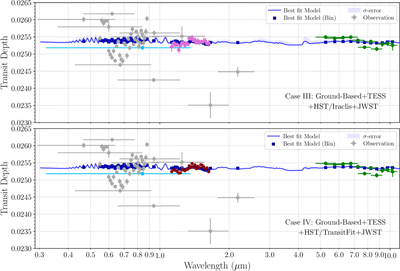
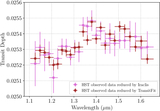
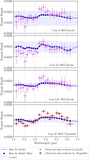
Caption: Figure 10.
The best-fit transmission spectrum model of WASP-43 b, calculated for the combined dataset including ground-based observations (gray circles), TESS (light-blue circles), HST processed with Iraclis (pink circles), HST processed with TransitFit (dark-red circles), and JWST (green circles). The synthetic model generated by TauREx is shown as a solid blue line, with the corresponding 1σ confidence region indicated by the blue shading. The binned best-fit model values are shown as blue squares. Note that the five outlier transit depths in the optical wavelength range correspond to the R, I, ﹩{z}^{{\prime} }﹩, H, and K filters, respectively.
Other Images in This Article
Show More
Copyright and Terms & Conditions
© 2026. The Author(s). Published by the American Astronomical Society.