Image Details
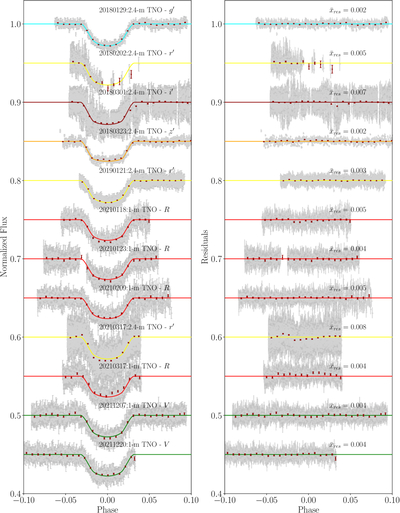
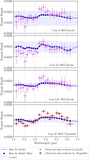
Caption: Figure 1.
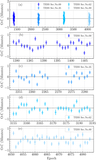
Left panels: the normalized, phase-folded transit light curves of WASP-43 b from the 2.4 m and 1 m TNT observations in the SPEARNET telescope network, shown as gray circles. The best-fitting model from TransitFit is displayed as a solid line. Right panels: residuals of the light curves after model subtraction. Both the light curves and residuals are vertically offset for clarity. The corresponding residuals and the mean residual values (﹩{\bar{x}}_{\mathrm{res}}﹩) with clear offsets are displayed in the right panel.
Other Images in This Article
Show More
Copyright and Terms & Conditions
© 2026. The Author(s). Published by the American Astronomical Society.
Copyright ©
2026 Astronomy Image Explorer. All Rights Reserved.