Image Details
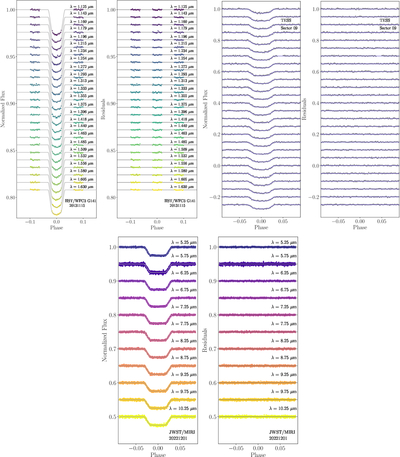
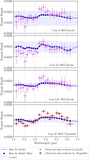
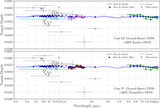
Caption: Figure 2.
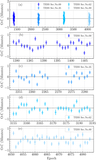
The normalized, phase-folded transit light curves of WASP-43 b are shown for HST/WFC3 G141 observations on 2013 November 15 (top left), TESS observations within Sector 9 (top right), and JWST/MIRI (bottom). The observational data are presented as circles, and the best-fitting model from TransitFit is shown as solid lines. Both the light curves and the corresponding residuals (right panels) are vertically offset for clarity.
Other Images in This Article
Show More
Copyright and Terms & Conditions
© 2026. The Author(s). Published by the American Astronomical Society.
Copyright ©
2026 Astronomy Image Explorer. All Rights Reserved.