Image Details
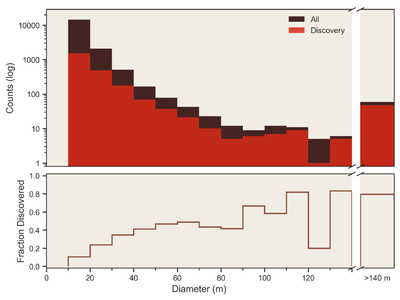
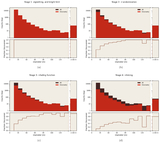
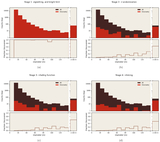
Caption: Figure 2.
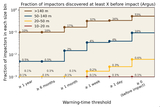
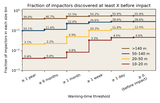
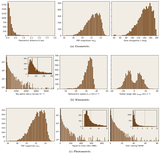
Size distribution and discovery efficiency of the synthetic impactor population, computed using uniform 10 m diameter bins up to 140 m and a collapsed terminal bin for all objects larger than 140 m. Top: log-scaled histograms showing the full population (dark brown) and the subset discovered by LSST (red). A break in the x-axis isolates the >140 m population corresponding to the PHA hazard regime. Bottom: discovery fraction (Discovered/All) for the same size-bin setup.
Other Images in This Article
Copyright and Terms & Conditions
© 2026. The Author(s). Published by the American Astronomical Society.
Copyright ©
2026 Astronomy Image Explorer. All Rights Reserved.