Image Details
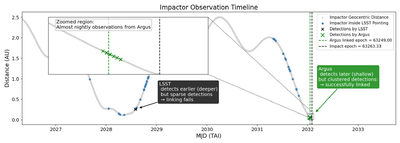
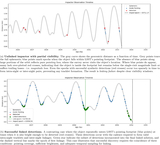
Caption: Figure 6.
Example impactor observation timeline illustrating a case where LSST detects the object but fails to achieve linkage, while Argus successfully links it. Gray curves show the object’s geocentric distance, with blue points marking times when it falls within LSST’s footprint. LSST detections (black crosses) are too sparsely spaced to satisfy linking requirements, whereas Argus detections (green crosses) form dense nightly clusters near close approach, enabling robust linkage, as highlighted in the inset. Vertical dashed lines show the Argus link epoch (green) and the impact epoch (black).
Other Images in This Article
Copyright and Terms & Conditions
© 2026. The Author(s). Published by the American Astronomical Society.
Copyright ©
2026 Astronomy Image Explorer. All Rights Reserved.