Image Details
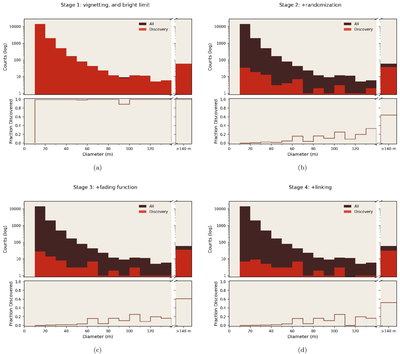
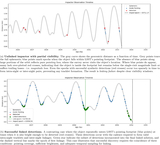
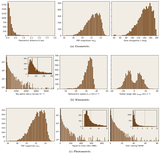
Caption: Figure 10.
Successive application of Sorcha’s survey-simulation filters and their impact on Argus impactor discovery, companion to Figure 9. Each panel shows the differential size distribution of all simulated impactors and the subset retained at that stage (top) and the corresponding retained fraction as a function of the diameter (bottom). (a) Stage 1 applies single-exposure photometric modeling (vignetting, bright magnitude limit). (b) Stage 2 adds observation randomization, introducing realistic pointing and per-visit variability. (c) Stage 3 enables the source-detection efficiency (“fading”) function, probabilistically removing marginal detections near the limiting magnitude. (d) Stage 4 applies the linking filter, retaining only detections that form a valid linkage. In contrast to the LSST sequence (Figure 9), Argus losses are dominated by photometric limitations, with relatively few additional objects removed at the linking stage. Together, these panels show that Argus primarily recovers only the brightest, late-appearing impactors, while cadence plays a secondary role.
Other Images in This Article
Copyright and Terms & Conditions
© 2026. The Author(s). Published by the American Astronomical Society.