Image Details
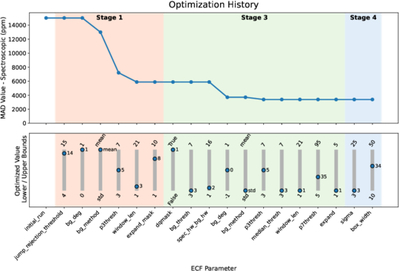
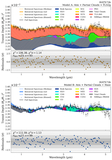
Caption: Figure A1.
Optimization history for the parameter-by-parameter data reduction with the optimized Eureka! pipeline. Top: MAD of the spectroscopic light curves after each successive update to an individual ECF parameter, with the caveat of spec_hw and bg_hw being evaluated in a nested-loop; coincidentally both parameters yielded an optimized value of 2 in this optimization. Shaded regions indicate the subsets of parameters adjusted in Stages 1, 3, and 4 of the reduction. Bottom: Final optimized value for each parameter relative to its allowed bounds, with the lower and upper bounds annotated below and above each slider. Note that the Eureka! labels shown in the x-axis are provided verbatim from their ECF parameter namings (e.g., spec_hw: the half-width of aperture region for spectral extraction). A detailed explanation and units for each parameter is available at ReadTheDocs: Eureka! Control Files (.ecf). (2026).
Other Images in This Article
Show More
Copyright and Terms & Conditions
© 2026. The Author(s). Published by the American Astronomical Society.