Image Details
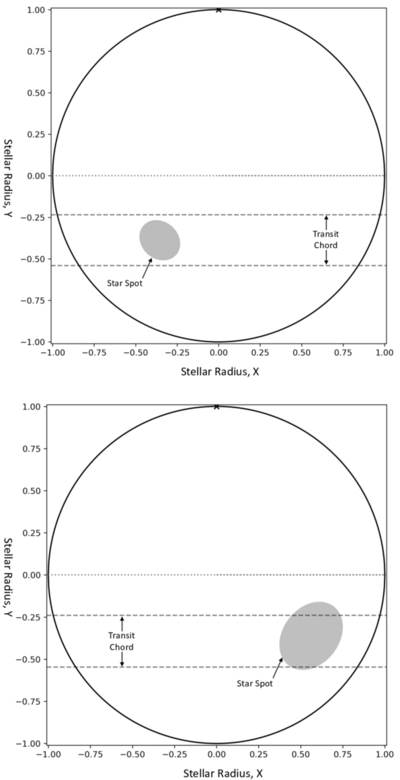
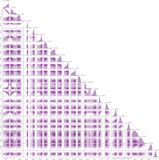
Caption: Figure 2.
Modeled fleck star spots for Visits 1 (top) and 2 (bottom). Visit 3 is not shown because the preferred transit model is spot-free for the Eureka!+fleck reduction. Interestingly, the spots share roughly the same latitude across the transit chord, with similar spot contrasts of 0.960 ± 0.008 and 0.971 ± 0.002 for Visits 1 and 2, respectively. Characteristics for the spots modeled for both reductions are detailed in Table A1.
Other Images in This Article
Show More
Copyright and Terms & Conditions
© 2026. The Author(s). Published by the American Astronomical Society.
Copyright ©
2026 Astronomy Image Explorer. All Rights Reserved.