Image Details
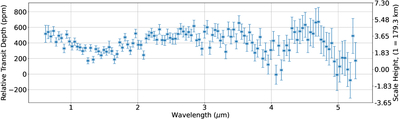
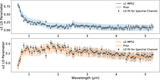
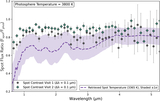
Caption: Figure 5.
The relative transit depth and scale heights for the optimized Eureka!+fleck transmission spectra. The spectrum shown here is a weighted average of all three transits. Scale heights assume a mean molecular weight of μ = 2.2.
Other Images in This Article
Show More
Copyright and Terms & Conditions
© 2026. The Author(s). Published by the American Astronomical Society.
Copyright ©
2026 Astronomy Image Explorer. All Rights Reserved.