Image Details
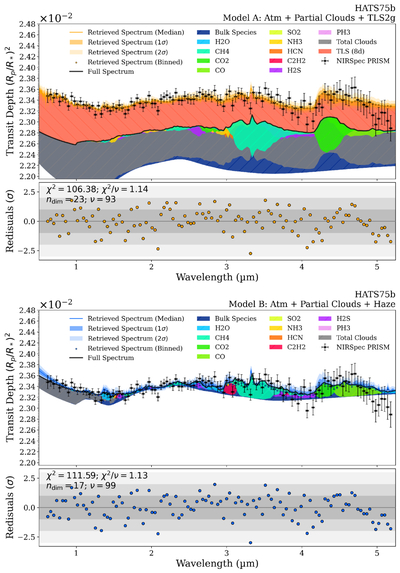
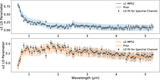
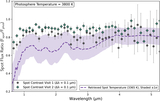
Caption: Figure 6.
Retrieval fits to the HATS-75 b coadded transmission spectrum for the preferred TLS contamination model (top plot) and preferred haze model (bottom plot). Both plots show the spectral fit (upper panel) and the relative residual (lower panel). The data (black error bars) are compared against the median retrieved transmission spectrum with 1σ and 2σ credibility envelopes. The black model shows the best-fitting planet spectrum simulated without TLS contamination (contribution highlighted in red). Shading below the best-fit atmosphere shows molecular contributions to the spectrum.
Other Images in This Article
Show More
Copyright and Terms & Conditions
© 2026. The Author(s). Published by the American Astronomical Society.
Copyright ©
2026 Astronomy Image Explorer. All Rights Reserved.