Image Details
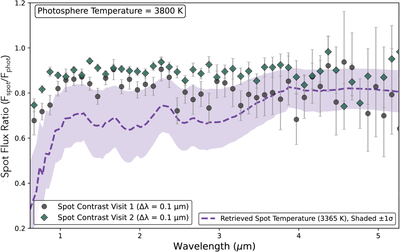
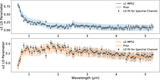
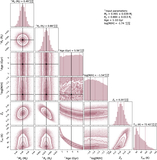
Caption: Figure A2.
Spot flux ratios assuming a 3800 K stellar photosphere temperature in agreement with both the retrieved photosphere temperature as well as high resolution observations in A. Jordán et al. (2022). Spot flux ratios from Visit 1 (teal) and Visit 2 (purple) derived from the spotrod fits are plotted against wavelength. The expected spot flux ratios derived from the retrieved spot temperature of 3365 K is included for comparison along with the 1σ uncertainty region. While the measured spot flux ratios are offset, they still capture the overall structure expected from stellar models.
Other Images in This Article
Show More
Copyright and Terms & Conditions
© 2026. The Author(s). Published by the American Astronomical Society.
Copyright ©
2026 Astronomy Image Explorer. All Rights Reserved.