Image Details
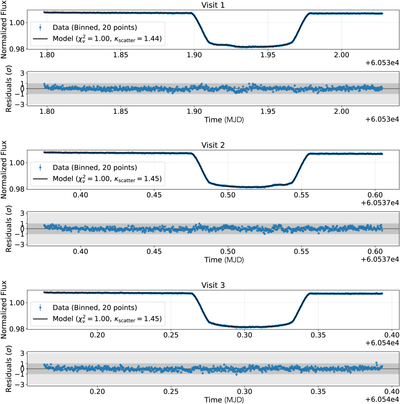
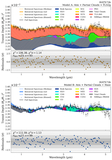
Caption: Figure 1.
White light curves and best-fit transit models for Visits 1 (top), 2 (middle), and 3 (bottom) of the optimized Eureka!+fleck dataset. Residuals for the model-fits are provided below the light curve of the same transit to show time-correlated noise. The bump near the ingress of Visit 1, to the left of the transit center (∼1.92 + 6.053e4 MJD), represents the starspot illustrated in the top plot of Figure 2. Similarly, the raised feature near the egress of Visit 2, to the right of the transit center (∼0.54 + 6.0537e4 MJD), represents the starspot illustrated in the bottom subfigure of Figure 2. ﹩{\chi }_{\nu }^{2}﹩ and scatter multiplier values, κscatter (T. Bell et al. 2022; B. M. Morris 2022), are provided as metrics for the model-fit and necessary error inflation (to planet radius estimates) during light-curve fitting.
Other Images in This Article
Show More
Copyright and Terms & Conditions
© 2026. The Author(s). Published by the American Astronomical Society.