Image Details
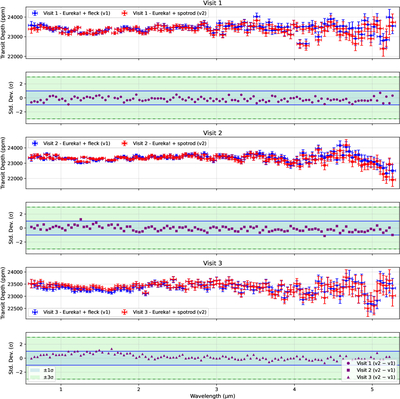
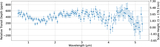
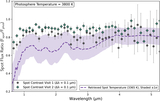
Caption: Figure 3.
A comparison of the independently generated optimized Eureka!+fleck and manual Eureka!+spotrod transmission spectra for all three visits. Nearly all values fall within ±1σ relative to the other reduction, providing strong validation of the spectra generated for all visits across both approaches.
Other Images in This Article
Show More
Copyright and Terms & Conditions
© 2026. The Author(s). Published by the American Astronomical Society.
Copyright ©
2026 Astronomy Image Explorer. All Rights Reserved.