Image Details
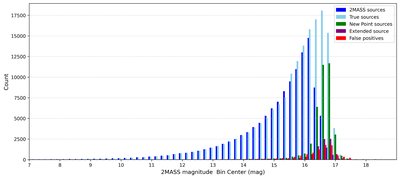
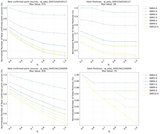
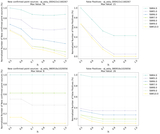
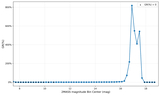
Caption: Figure 8.
Distribution of different source categories across 2MASS magnitude bins in the test set. Each grouped bar chart comprises five distinct color-coded categories: point sources from the PSC (dark blue); all confirmed sources (light blue); new confirmed point sources (green); extended sources (purple); and false positives (red). All magnitude bins have a fixed width of 0.2 magnitudes. The horizontal axis represents the median values of the 2MASS magnitude bins, while the vertical axis indicates the number of corresponding detected sources in each bin.
Other Images in This Article
Copyright and Terms & Conditions
© 2026. The Author(s). Published by the American Astronomical Society.
Copyright ©
2026 Astronomy Image Explorer. All Rights Reserved.