Image Details
Caption: Figure 2.
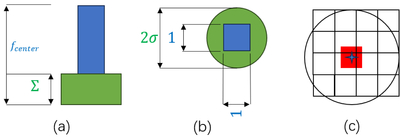
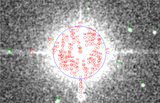
(a) Schematic side view of a faint source showing the peak flux and its surrounding region. (b) Top view of the faint source. Panels (a) and (b) facilitate the interpretation of Equations (7) and (8), highlighting the peak flux fcenter (blue) and the flux surface density σ (green). (c) Spatial relationship between the 1 × 1 pixel region used for peak flux calculation (red) and other pixels of the detected source.
Other Images in This Article
Copyright and Terms & Conditions
© 2026. The Author(s). Published by the American Astronomical Society.
Copyright ©
2026 Astronomy Image Explorer. All Rights Reserved.