Image Details
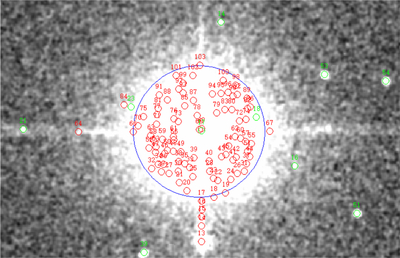
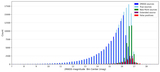
Caption: Figure 6.
Schematic diagram of false positive distribution around saturated sources. Green points represent 2MASS point sources, red points indicate detected false positives, and the large blue circle denotes the region within a <57″ radius centered on the saturated source.
Other Images in This Article
Copyright and Terms & Conditions
© 2026. The Author(s). Published by the American Astronomical Society.
Copyright ©
2026 Astronomy Image Explorer. All Rights Reserved.