Image Details
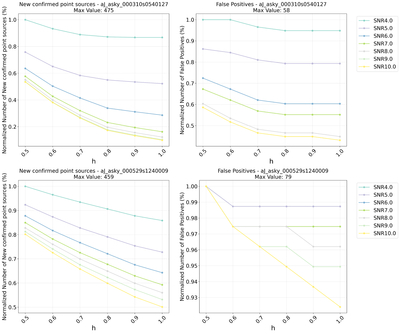
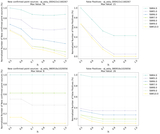
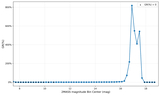
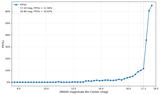
Caption: Figure 4.
Variation in the retention counts of new confirmed point sources (left) and false positives (right) with h under different SNR filtering ranges for Atlas images in dense stellar fields. The images are from Sky Regions 7 and 8. The horizontal axis represents h, while the vertical axis shows the normalized count of detected sources (relative to the maximum count). Curves in different colors correspond to different upper SNR limits. The subplot titles indicate the maximum number of detected sources.
Other Images in This Article
Copyright and Terms & Conditions
© 2026. The Author(s). Published by the American Astronomical Society.
Copyright ©
2026 Astronomy Image Explorer. All Rights Reserved.