Image Details
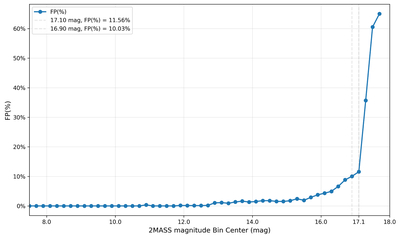
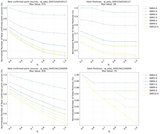
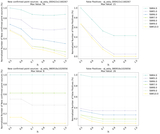
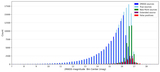
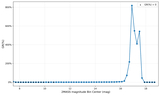
Caption: Figure 10.
Variation of false positive rate across 2MASS magnitude bins in the test set. The horizontal axis uses the same magnitude bins as defined in Figure 8, and the vertical axis represents the false positive rate.
Other Images in This Article
Copyright and Terms & Conditions
© 2026. The Author(s). Published by the American Astronomical Society.
Copyright ©
2026 Astronomy Image Explorer. All Rights Reserved.